
Verido
A dashboards and reporting system that brings scattered business data into one clear, real-time view, with decisions 32% faster and manual reporting down 40%.
- Client
- Verido
- Service
- Custom Development
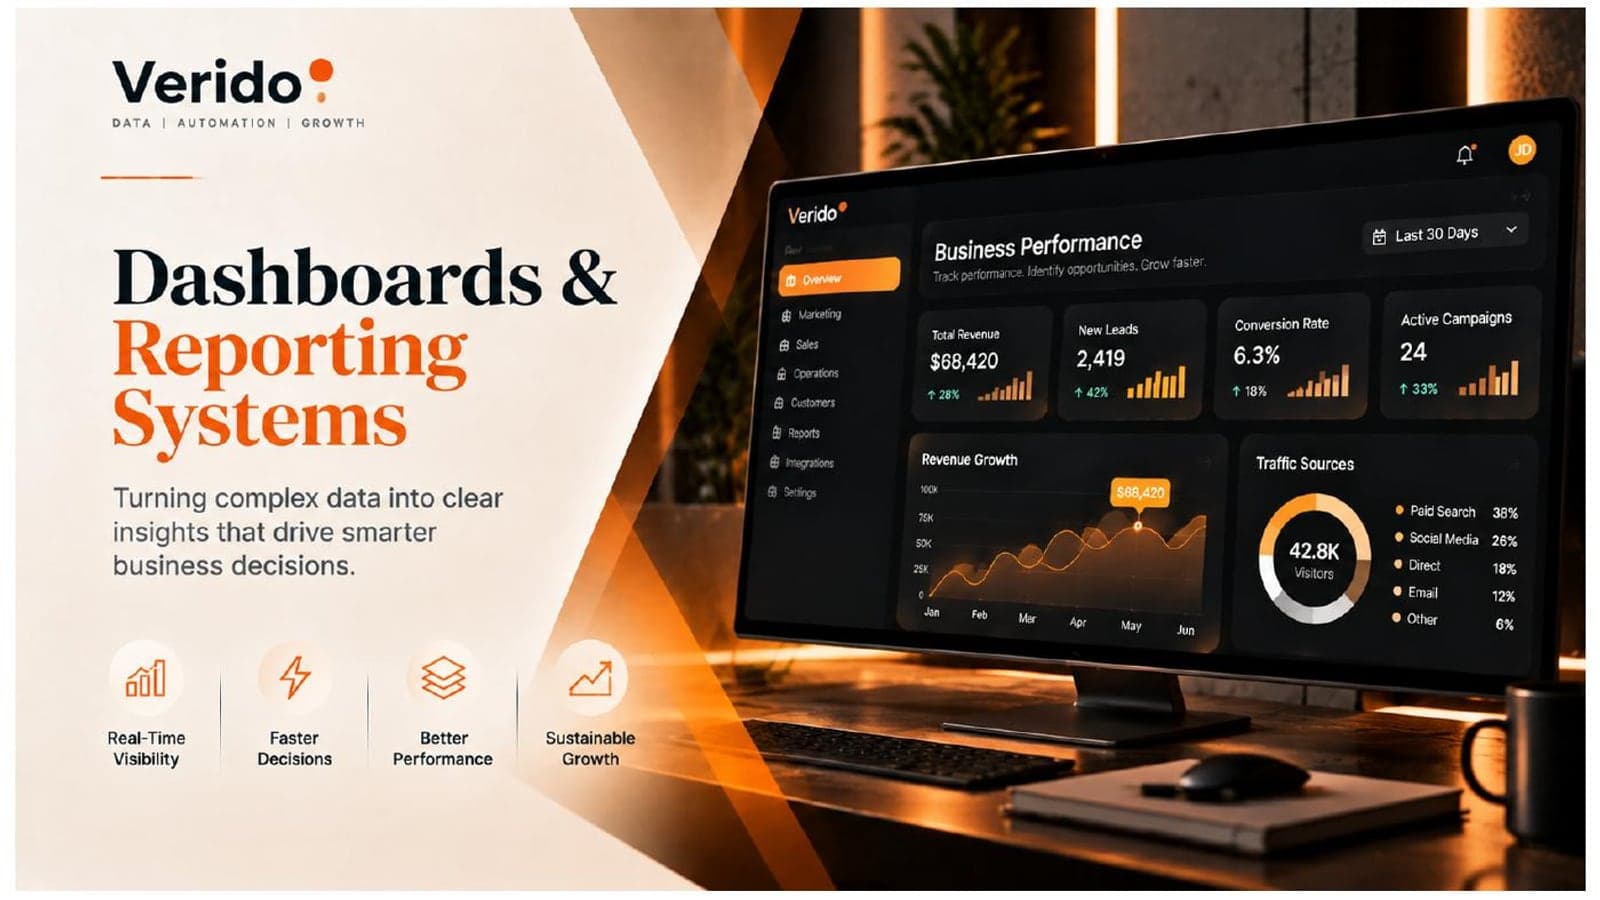
01Overview
For Verido we built a dashboards and reporting system that turns complex data into clear insights, so decisions get smarter and faster.
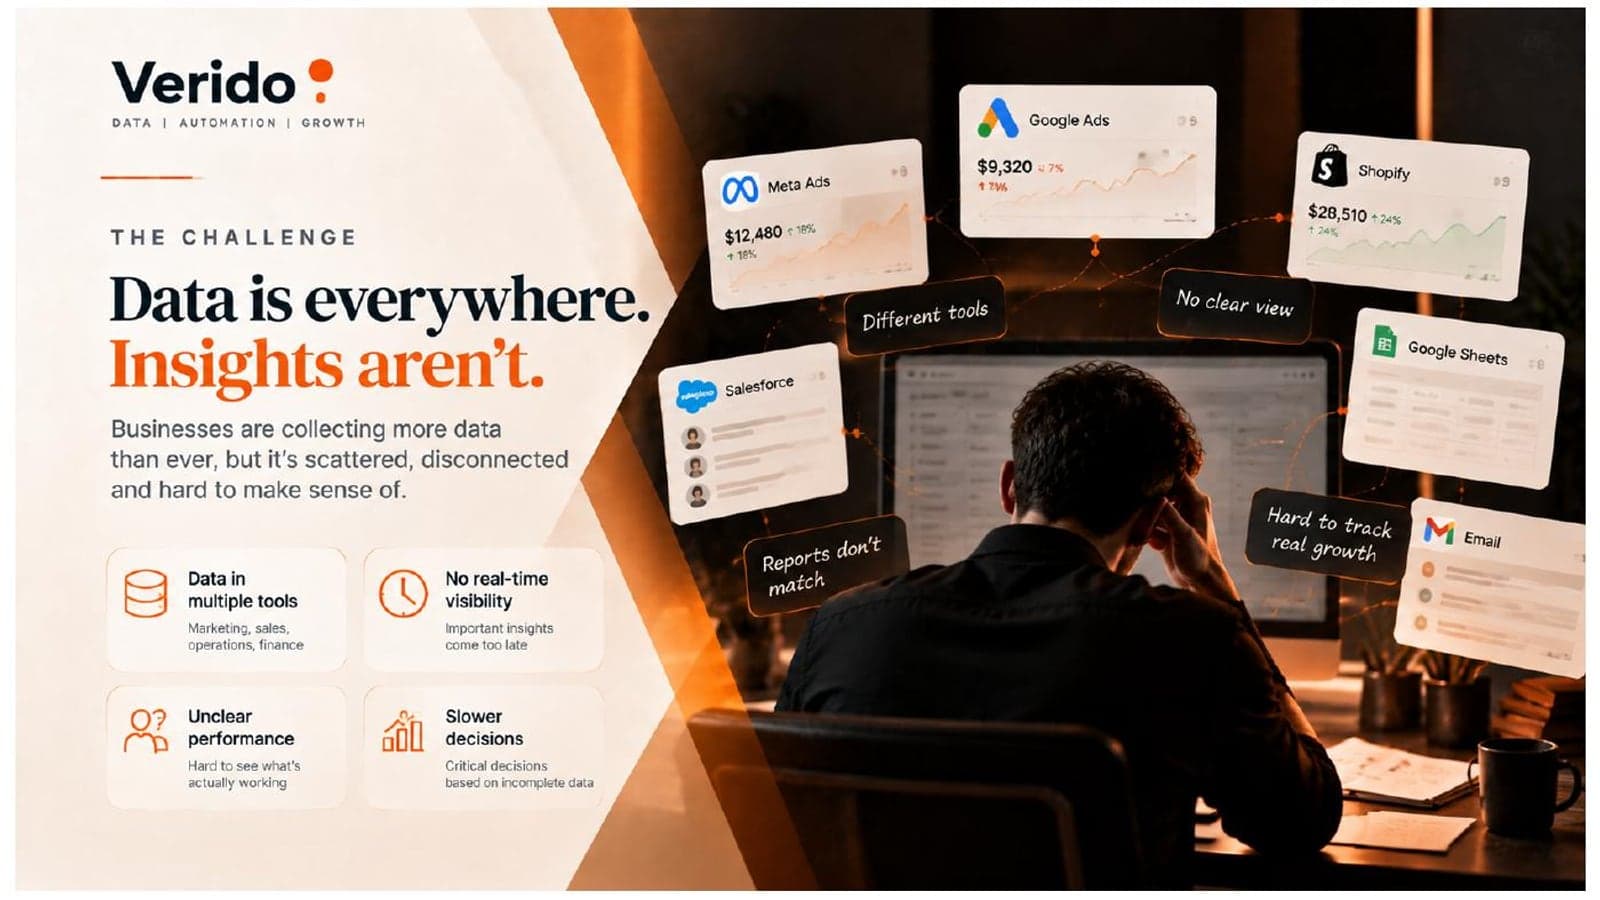
02The challenge
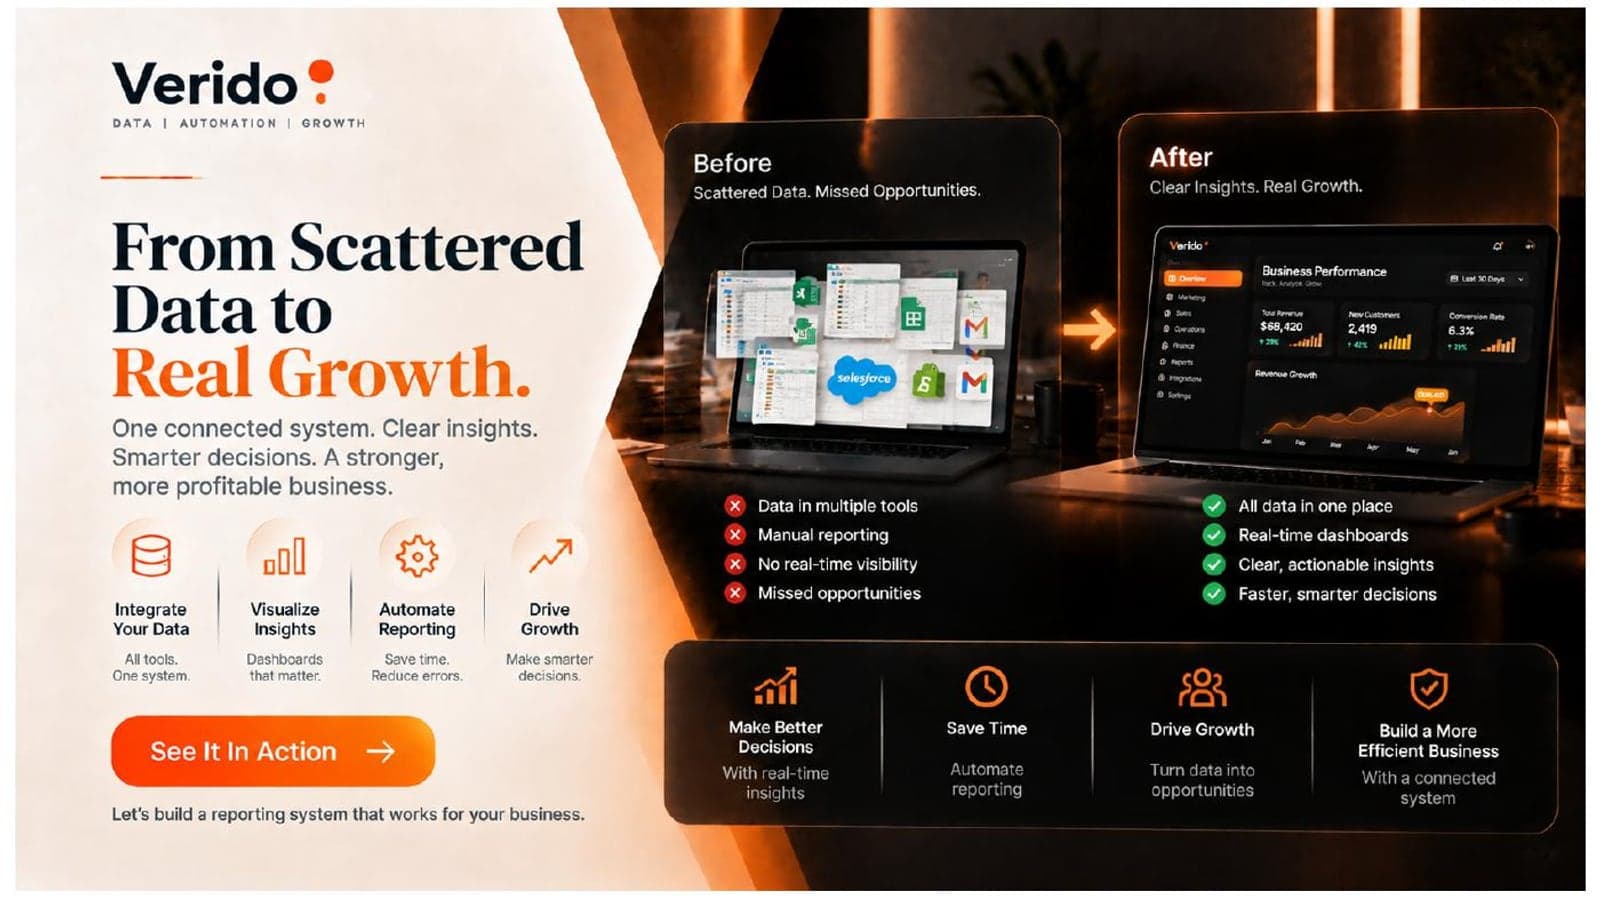
Data was everywhere and insights were not. Numbers sat in separate tools such as Meta Ads, Google Ads, Shopify, Salesforce, Google Sheets and email, with no real-time visibility, unclear performance and slower decisions.
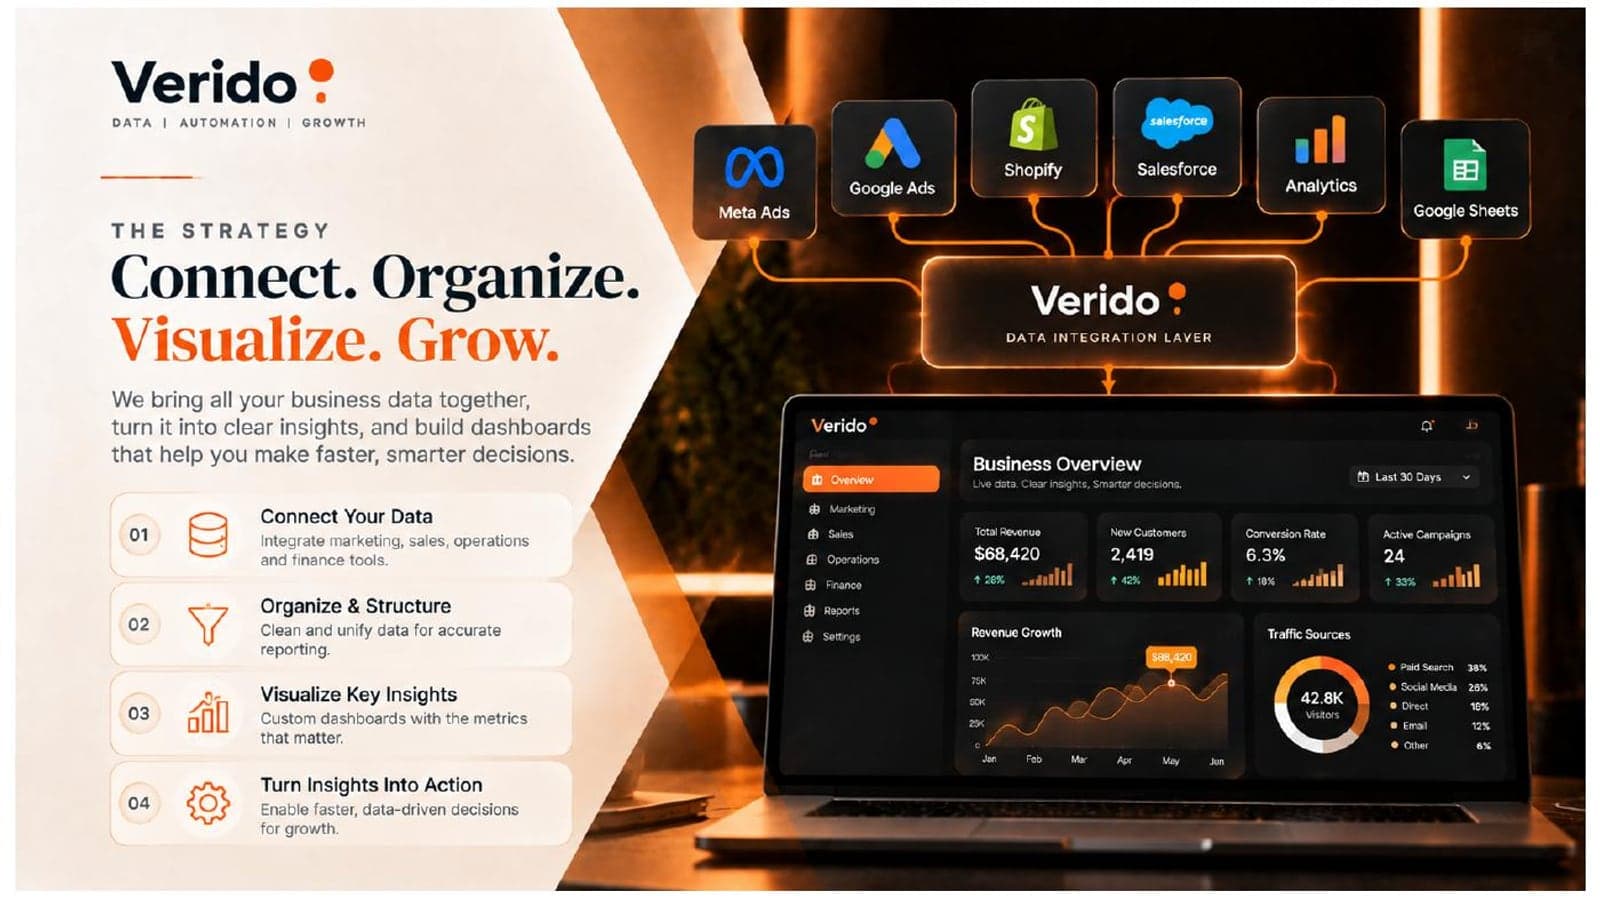
03The strategy
Connect, organize, visualize, grow. Marketing, sales and operations data is brought together through one integration layer, structured for accuracy, shown in custom dashboards and turned into action.
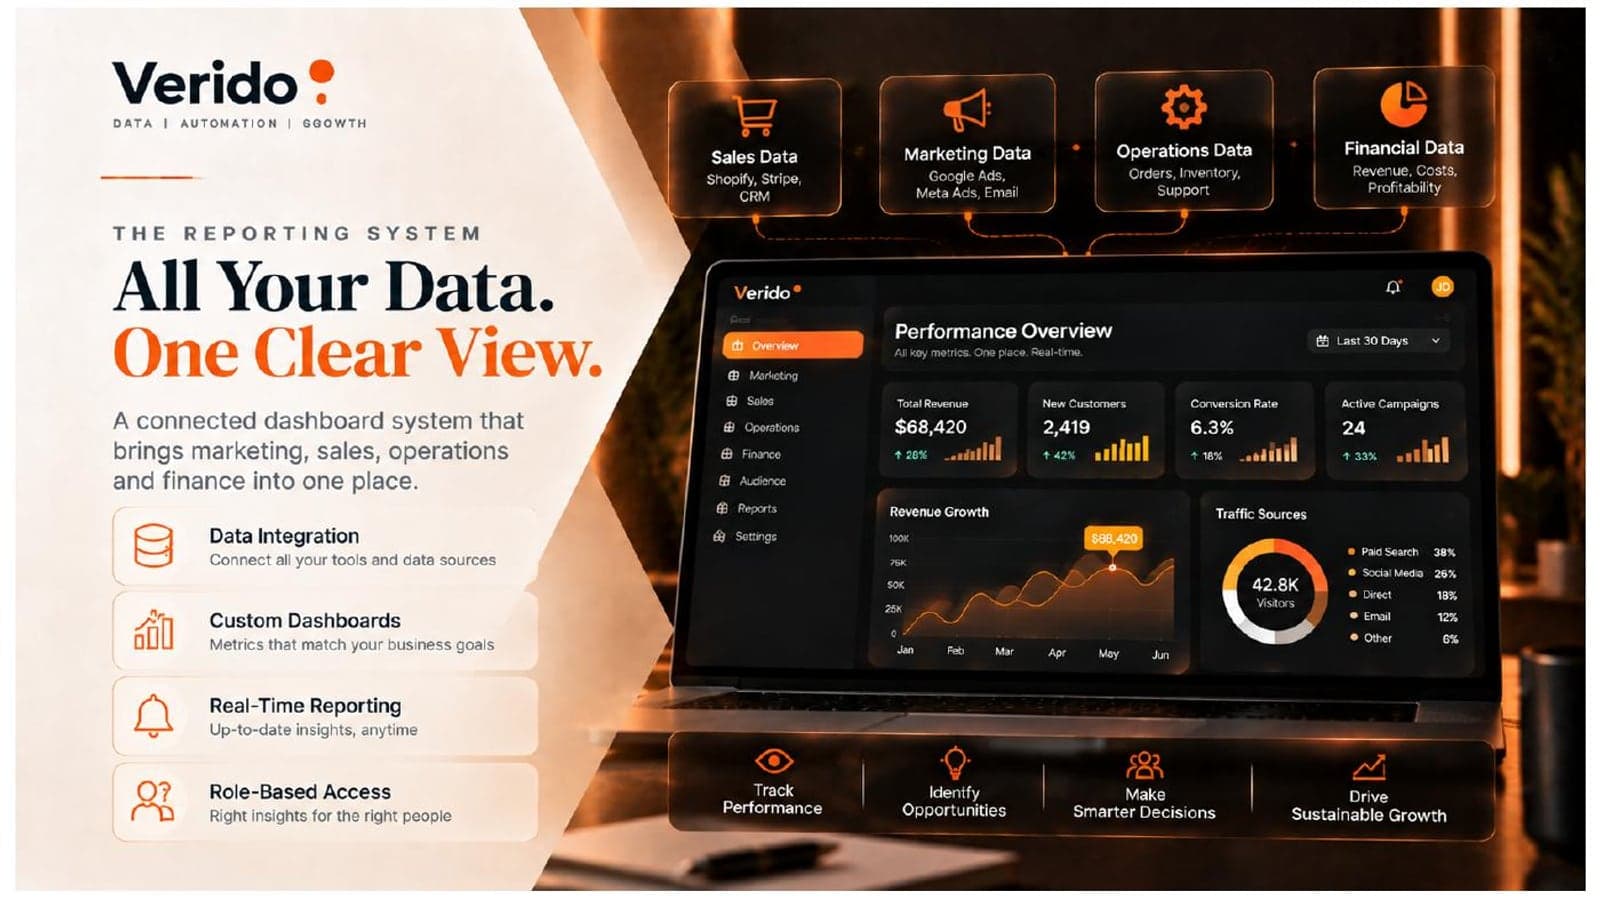
04The reporting system
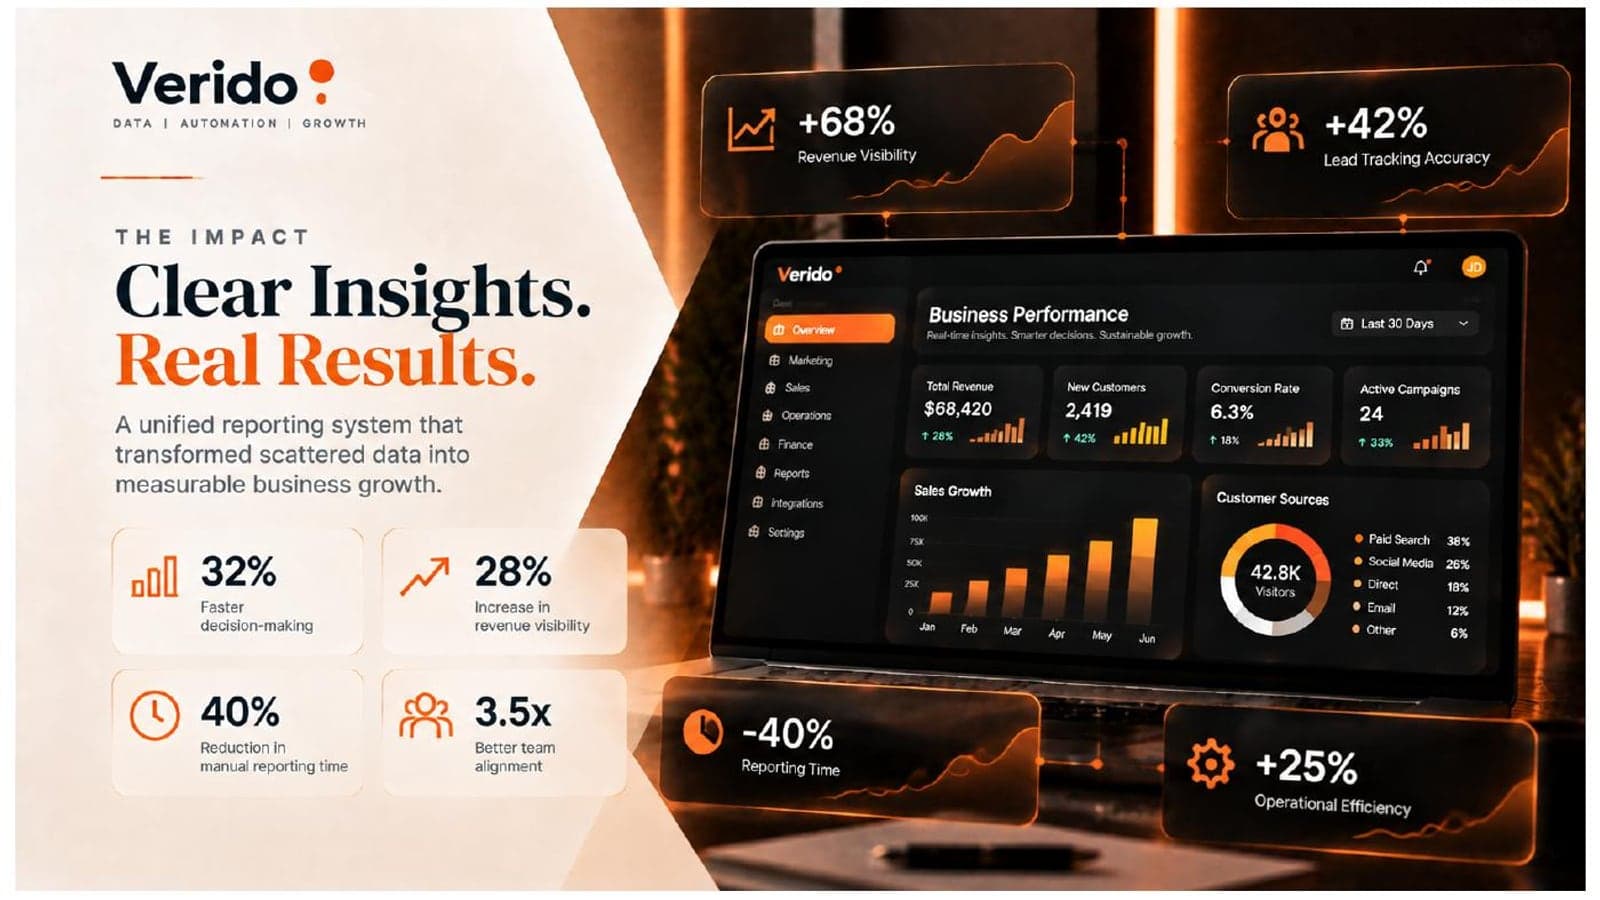
One connected dashboard system that brings marketing, sales, operations and finance data into one place, with custom dashboards, real-time reporting and role-based access.
05The impact
Revenue visibility up 68% and lead tracking accuracy up 42%, with decisions 32% faster, manual reporting time down 40%, team alignment 3.5 times better and operational efficiency up 25%.
06The close
From scattered data to real growth. Before, data sat in multiple tools with manual reporting and missed opportunities. After, everything is in one place, with real-time dashboards and clear, actionable insights.